 Phoenix Project
 Phoenix Project
About Our Logo
The Phoenix Project is a study group of the Twin Cities IEEE to develop an ambulatory blood pressure monitor for the Halberg Chronobiology Center at the University of Minnesota. Our goal is to make a monitor that is inexpensive, unobtrusive, easy to use and collects a week of blood pressure measurements.
Our Logo is composed of a Microsoft clip-art drawing showing the interior of a human heart and some of the blood vessels, an abstract electrocardiogram (ECG) tracing in red and an abstract week-long systolic blood pressure cycle in blue, provided by the Halberg Chronobiology Center (drawn along two different time scales!). The logo symbolizes the investigation of variation in blood pressure.
Franz Halberg notes "The magnifying lens refers to the analyses, currently available for all comers from Germaine Cornélissen at corne001@umn.edu carried out in the light of a special data base and special software available and used in her center. The data collection for 7 days is not even half of the story. All data can be normal in terms of being below target values such as 130 mmHg systolic pressure (when the heart contracts) but if the swing is excessive, yet occurs within a "normal range", there can still be an elevated risk. This change in variability is what should be treated to avoid a severe event such as a stroke or myocardial infarction."
There is no justification in the new millennium (with its monitoring and analyzing technology available) for a so-called time-unqualified normal range -- for reliance upon a single 'static' measurement, currently considered by official guidelines, see www.well-net.com/cardiov/hahbp.html or JNC 7's recent reclassification of blood pressure for adults, that should and can be replaced by a chronomic interpretation, see Why 7-Day Blood Pressure Monitoring? Healthwatch 3."
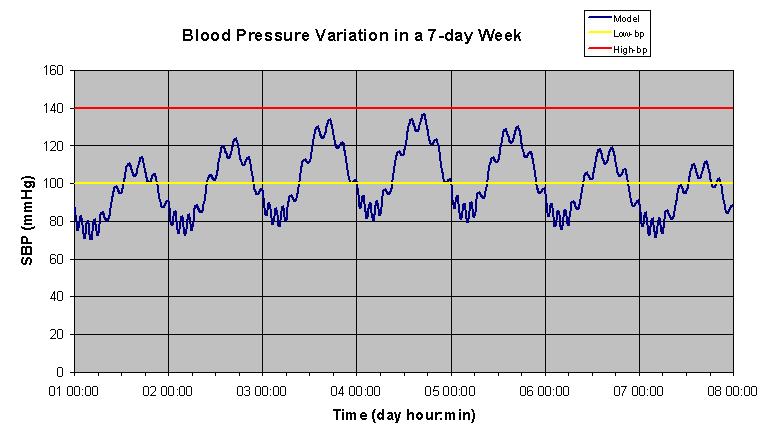
The image below shows an idealized 7-day profile of systolic blood pressure, picturing some of the features found in actual data, namely a prominent circadian rhythm with a period of about 24 hours and higher values during the active span than during the rest span, an about 7-day component with higher values during mid-week than during the weekend, and an about 1.7-hour component related to the REM cycle by night (e.g., from 00:00 to 06:50), frequency demultiplied into an about 3.4-hour component by day (e.g., from 06:50 to 24:00). The 7-day component is also modulating the circadian amplitude, showing larger amplitudes during mid-week than during weekends.
Therefore, it is important to assess the blood pressure variations (cycles), not a static value. The concept of the chronome (41 KB pdf) was introduced to enable this. A more detailed presentation is given in Chronomics (2.3 MB pdf), also referenced in our bibliography.
About This Page
This page is maintained by Ellis S Nolley. It was last updated on 10 January 2005.
The author(s) provide this information as a public service, and agree to place any novel and useful inventions disclosed herein into the public domain. They are not aware that this material infringes on the patent, copyright, trademark or trade secret rights of others. However, there is a possibility that such infringement may exist without their knowledge. The user assumes all responsibility for determining if this information infringes on the intellectual property rights of others before applying it to products or services.
Copyright (C) 2004 Ellis S. Nolley. Copying and distribution of this page is permitted in any medium, provided this notice is preserved.
